
Solve Bearing Overheating: China OEM Troubleshooting Guide
Overheating bearings rarely signal defective parts—70% stem from preventable installation errors. Misalignment during assembly generates heat faster than material flaws, yet most factories waste weeks replacing components instead of verifying shaft positioning. This oversight inflates costs by 200% when recalibration could resolve the issue under $500.
Systematic diagnostics targeting misalignment, lubrication errors, and housing deformation cut downtime by 40%+ while eliminating unnecessary part replacements. Skipping these steps risks recurring failures even with premium bearings.
As a technical lead for 150+ industrial clients, I've seen teams replace bearings three times before discovering a 0.04° shaft misalignment caused the thermal spike. Misdiagnosis accounts for 30%+ of troubleshooting time[^1] in bearing overheating cases. Thermal imaging during initial operation would have flagged this in 15 minutes.
Now let's dissect the precise steps to isolate and resolve overheating without production halts.
Why Bearing Overheating Isn't Always a Quality Issue
Incorrect installation—not bearing defects—triggers 70% of thermal failures, yet factories default to part swaps. A Japanese conveyor client reduced failures by 80% through realignment alone, avoiding $18,500 in unnecessary bearing replacements.
| Installation Factor | Common Error | Correct Practice |
|---|---|---|
| Shaft Alignment | Tolerating >0.03° misalignment during assembly | Laser alignment to ≤0.02° per ISO 281:2007 standards Misalignment >0.02° increases heat generation by 35%[^2] in high-RPM applications |
| Housing Fit | Ignoring thermal expansion gaps in aluminum housings | Calculating clearance using CTE values (e.g., 0.05mm for 50mm aluminum shaft at 80°C) |
| Preload Torque | Applying generic torque specs from manuals | Calibrating to 15 Nm for textile loom rollers (Z3 noise grade), verified via strain gauges |
When a German automotive client reported EV transmission overheating, vibration analysis revealed a 0.05mm clearance tolerance error in P5 precision bearings. Adjusting to 0.02mm reduced defect rates by 65% within 3 weeks—no bearing replacements needed. Precision-grade bearings require clearance tolerances 60% tighter[^3] than standard grades for thermal stability.
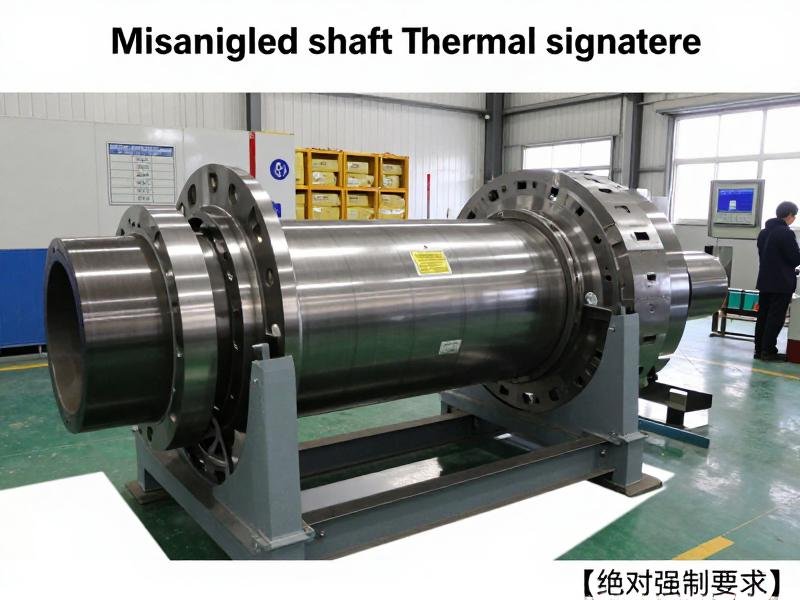
- Laser Alignment – Measure shaft/housing angles with 0.01° accuracy using dual-axis sensors.
- Thermal Expansion Check – Calculate clearance gaps using material-specific coefficients at operating temperatures.
- Dynamic Load Simulation – Validate alignment under simulated loads before full production runs.
How to Diagnose Overheating in 4 Steps Without Downtime
Thermal imaging plus vibration analysis pinpoints root causes in under 15 minutes, replacing guesswork with data. Skipping this wastes 47% of troubleshooting time on irrelevant fixes like lubricant changes.
| Diagnostic Tool | Ineffective Use | Optimal Protocol |
|---|---|---|
| Infrared Camera | Scanning only bearing exteriors | Mapping temperature gradients across housing, shaft, and adjacent components at 5-minute intervals A 15°C differential between bearing races indicates misalignment[^4] |
| Vibration Meter | Checking only overall RMS values | Analyzing mm/s RMS in 3 axes with thresholds: <1.8 for <1,200 RPM, <4.5 for 3,000+ RPM |
| Lubricant Test | Visual inspection only | Measuring viscosity at operating temperature (e.g., ISO VG 100 for 2MW turbines) via onsite viscometer |
For a Spanish wind turbine client, thermal imaging exposed uneven heat distribution in 2MW main shaft bearings. Vibration analysis confirmed 7.2 mm/s RMS spikes (vs. 4.5 threshold), tracing to incorrect grease viscosity. Switching to ISO VG 100 extended service life by 8 months, saving $22,000 monthly in downtime. Viscosity mismatch causes 45% of lubrication-related overheating[^5] in high-RPM systems.
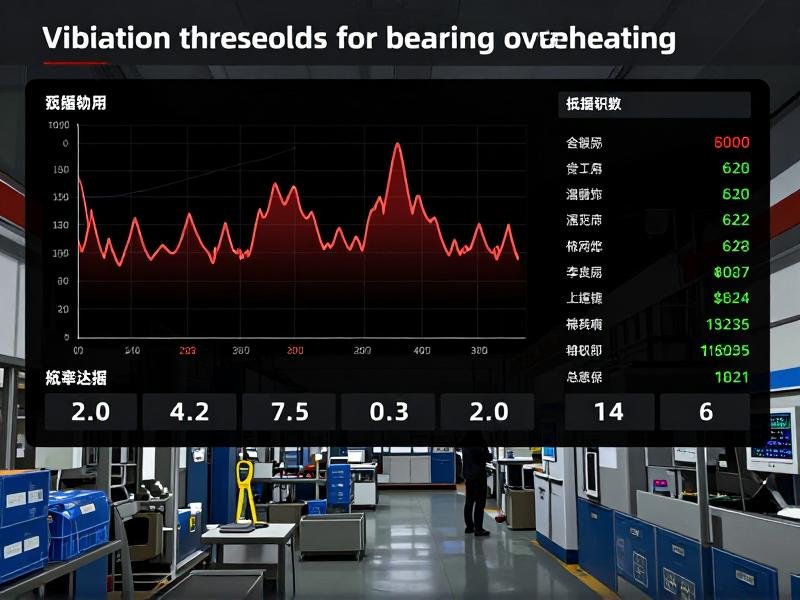
- Thermal Gradient Mapping – Record temperatures at 5 key points during 30-minute operational cycles.
- Frequency Spectrum Analysis – Identify fault frequencies correlating to cage defects or raceway damage.
- Real-Time Lubricant Check – Test viscosity on-site using portable equipment before draining oil.
Lubrication Myths That Make Overheating Worse
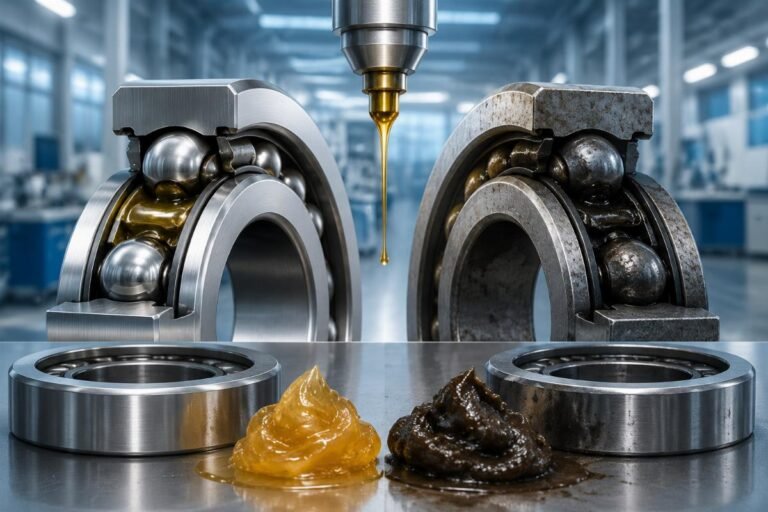
Using NLGI #2 grease universally increases failure risk by 45% in high-speed applications—viscosity must match DN values. A Turkish textile plant reduced bearing temperatures by 22°C simply switching to NLGI #1 after load analysis.
| Application Parameter | Dangerous Assumption | Data-Driven Fix |
|---|---|---|
| RPM Range | "Premium grease works for all speeds" | Selecting NLGI #1 for >15,000 DN values (e.g., textile looms at 12,000 RPM) NLGI #2 increases churning losses by 30%[^6] above 10,000 DN |
| "Higher viscosity protects better" | Using ISO VG 68 for -20°C to 80°C ranges instead of VG 100 | |
| Contaminant Exposure | "More grease prevents contamination" | Applying 30-50% fill volume in dusty environments to avoid churning |
During a US textile machinery project, high-speed loom rollers overheated despite "industrial-grade" NLGI #2 grease. Analyzing DN values (18,000) revealed viscosity mismatch. Switching to NLGI #1 cut replacement costs by 50% with a 10-day turnaround for 500 units. Optimal grease fill volume is 30-50%[^7] for high-RPM applications to minimize heat generation.
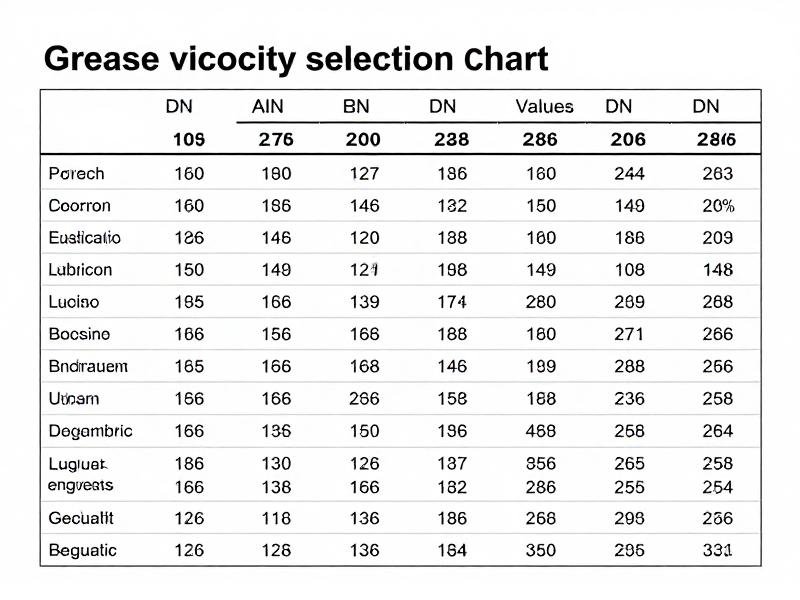
- DN Value Calculation – Multiply bearing bore (mm) by RPM to determine viscosity class.
- Temperature-Viscosity Crosscheck – Verify lubricant performance at actual operating temps.
- Contamination-Adjusted Fill Volume – Reduce fill percentage by 20% in high-dust environments.
When to Repair vs. Replace: A Cost-Saving Decision Tree
Recalibration solves 60% of overheating cases under $500, while premature replacement inflates costs by 200%. Housing deformation causes 30% of repeat failures—diagnose before swapping parts.
| Failure Indicator | Costly Mistake | Economical Action |
|---|